I am building a SaaS product that emails branded monthly performance reports as PDFs: a KPI row, a twelve-month trend chart, aging bars, a couple of tables, a short narrative. Two pages. Nothing exotic. This is the story of how generating those two pages nearly forced us to double our server size — and how deleting an entire browser from the stack turned out to be the better engineering decision.
Round one: the default answer
The industry-default way to make a PDF in 2026 is to render HTML and hand it to headless Chrome. We already had the report as a web page, so the appeal was obvious: one template, pixel-perfect parity between screen and paper. In Elixir the standard wrapper is ChromicPDF, which manages a pool of Chrome sessions over the DevTools protocol. We wired it up, and it worked — on my laptop.
Getting there still took a day of traps worth writing down. ChromicPDF's timeouts live under the session_pool option; a top-level :timeout is silently ignored, so the 5-second default kept firing on Chrome's cold starts no matter what we configured. The print_to_pdf call returns base64, not bytes — our first 'PDF' was a very confident-looking ASCII file. And printing from an HTML string means Chrome has no base URL, so a stylesheet referenced by path hangs the render forever until you add a <base> tag. None of these are bugs, exactly. They are the tax you pay for putting a browser in your pipeline.
Then production said no
Our app runs on the smallest sensible VM: one shared CPU, 512 MB of RAM. The BEAM idles at a couple hundred megabytes; Chromium wants roughly three hundred more the instant it wakes up, spread across a handful of processes. The first production render died with 'Chrome has stopped or was terminated by an external program.' We added a full gigabyte of swap. It died again. Chromium could not even dump the DOM of about:blank without the OOM killer taking it out.
The obvious fix was to pay for it: double the VM to 1 GB and move on. That is what most teams do, and it is why so much of the industry quietly runs a browser farm to print invoices. But the cost was not just the memory. The Docker image had grown by hundreds of megabytes of Chromium and fonts. Deploys were slower. The supervision tree carried a session pool with its own timeout tuning, sandbox flags for containers, and dbus noise in every log. All of that — to draw two pages of text, five bars, and two lines.
Round two: delete the browser
I maintain an open-source library called prawn_ex — Prawn-style declarative PDF generation in pure Elixir. No Chrome, no HTML: you build a document spec and it emits PDF 1.4 directly. Text, graphics primitives, tables, charts, images, a flow layout. The question was whether it could carry a real production report. The rule I set was simple: any gap we hit gets fixed in the library first, then the product consumes it. The library gets stronger; the product stays honest.
There were gaps, and they were instructive. Charts only spoke grayscale, but a white-label report needs the customer's brand color — so bar and line charts learned to accept {r, g, b} tuples alongside gray levels. Bar charts could not print values above the bars, so they gained value_labels with a formatter function for money. And the trend chart exposed the most interesting one: plotting two series as two separate line charts silently lies, because each normalizes to its own min and max. The library needed a multi_line_chart that draws every series on one shared scale, with an optional legend. That is the difference between a chart that looks right and a chart that is right.
PrawnEx.multi_line_chart(doc, [
  %{data: charges,     color: 0.62,            label: "Charges"},
  %{data: collections, color: {0.04, 0.31, 0.35}, label: "Collections"}
],
  at: {54, 430},
  width: 504,
  height: 190,
  from_zero: true
)
The subtlest gap was text encoding. The PDF base-14 fonts are single-byte, and UTF-8 punctuation pushed straight into a content stream comes out as mojibake — our bullets rendered as stray cent signs. The fix belonged in the library: declare WinAnsiEncoding on the fonts and transliterate UTF-8 to CP1252 on the way in, so bullets, en and em dashes, curly quotes and the euro sign just work, and unmappable codepoints degrade to a plain question mark instead of garbage. All of it shipped upstream as prawn_ex 0.3.0.
The numbers
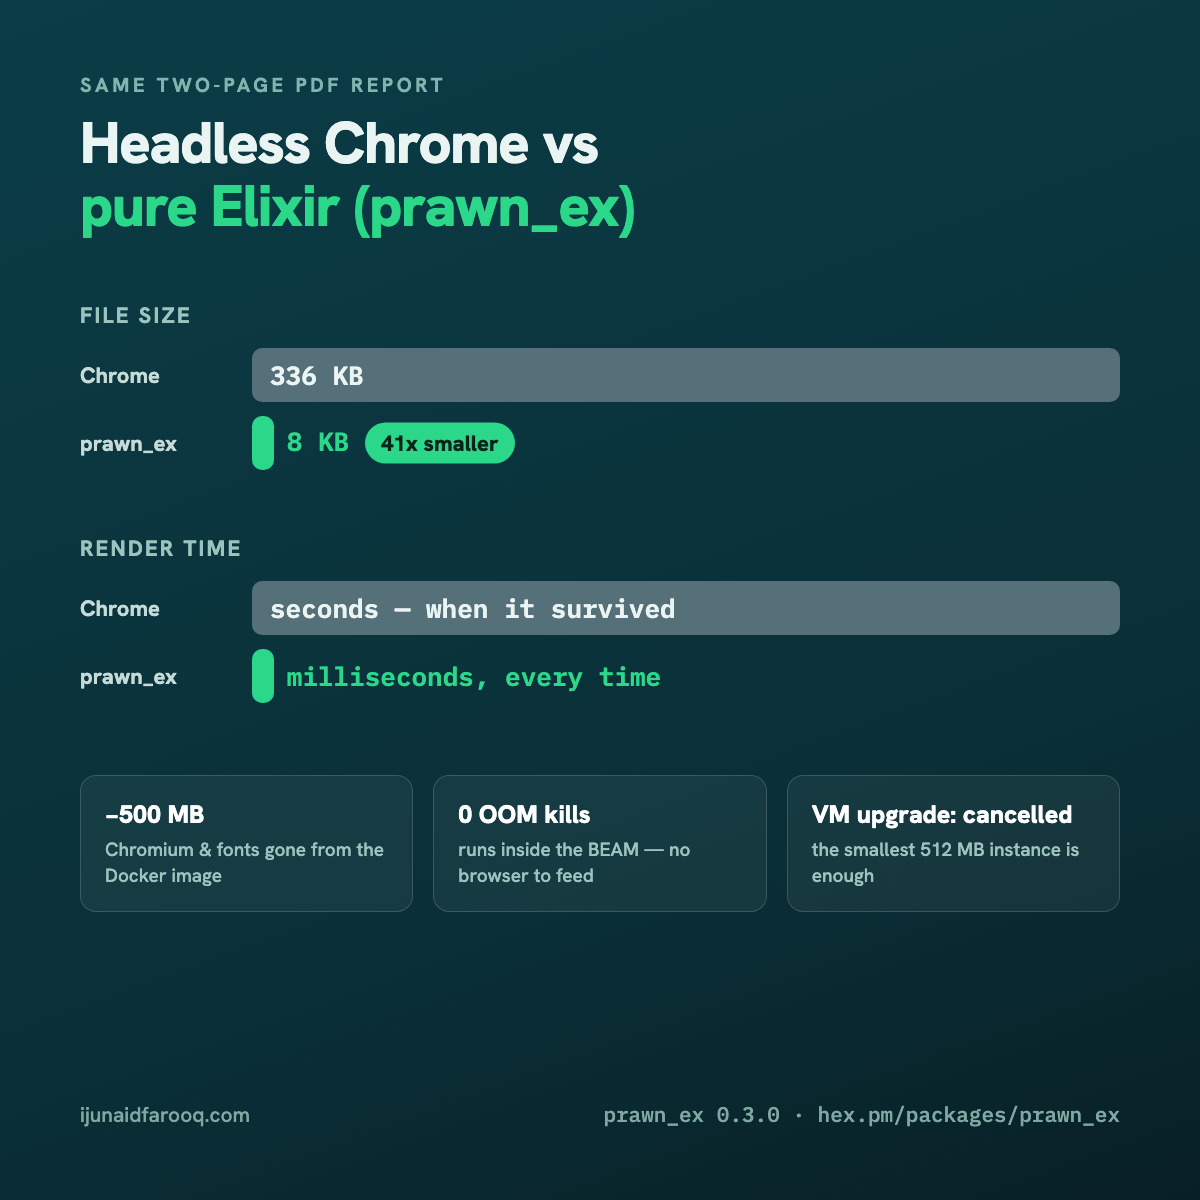
- File size: 336 KB with Chrome → 8 KB with prawn_ex. Same report, 41x smaller.
- Render time: seconds (plus cold-start roulette) → milliseconds, every time.
- Memory: OOM-killed on a 512 MB VM even with 1 GB of swap → runs inside the BEAM, no measurable footprint.
- Docker image: hundreds of MB of Chromium and fonts → zero extra layers.
- Infrastructure: a planned VM upgrade → cancelled. The smallest instance is enough.
- Moving parts: a browser pool with timeouts, sandbox flags and a base64 pipeline → one pure function from data to bytes.
What we gave up, honestly
Chrome gives you the entire CSS layout engine for free. With a declarative PDF library, layout is yours: you place the chart, you decide where the table starts, and if a heading collides with a bar you fix the coordinates yourself — we did, twice. If your document is a complex, ever-changing web page that must match the browser pixel for pixel, headless Chrome is still the right tool. But a data-heavy report with a known structure is not that. It is a layout you design once and fill with numbers forever, and for that shape of problem, owning the layout is a feature, not a cost.
Takeaways
- Question the default. 'Render HTML in headless Chrome' is a fine answer to a question most reports are not asking.
- Resource ceilings are design feedback. When a 512 MB box rejects your architecture, sometimes the architecture is wrong, not the box.
- Fix the library, not the app. Every gap patched upstream made the next project cheaper and the open-source tool better — five features in one release, each earned by a real production need.
- A shared scale is a correctness feature. Two separately-normalized charts on one axis are a lie with good intentions.